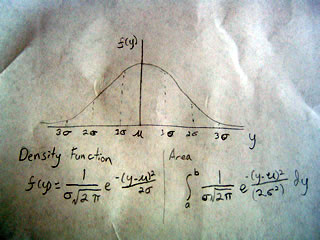
Here the mean is represented by mu, which looks like u and the standard deviation is measured by sigma, which looks like a flat 6.
The chances of being 1 deviation away from the mean are around 30%, 2 deviations is 5%, and 3 deviations is 1%
Like we covered yesterday the probability of values being between any point a and b can be found by taking the area under the curve at those points. The functions are there in the image, and as you can see, they are not fun to evaluate. Thus tables or computers are typically used to help obtain values as opposed to direct calculation.
The curve is also called the Gaussian curve in honor of Carl Friedrich Gauss, the German mathematician who found it. Another name is "Bell curve" since its shape represents a bell.


No comments:
Post a Comment