Variables can be anything:
number of apples and number of oranges
number of church goers and number of bibles
number of ciggies smoked and number of people with cancer
number of guns and amount of ammo
number of plastic toys sold and number of cartoons
From this list we can see that bivariate data is suggestive. Did you hear yourself say: "Yeah, totally related, that definitely causes the other".
And so comes one of the most notorious dilemmas in statistics: Causation vs. Correlation.
Causation means that one causes the other, like the more you drive your car, the less gas you have in the tank.
Correlation is mere chance, but not related. For example, if we were to look at the number of people paying taxes and the number of people who die we would find a pretty good correlation, but, this doesn't count since taxes don't kill you...no matter how convinced you are that they do.
Consider this example:
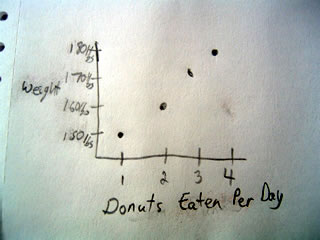
Here we see that the more donuts a person eats per day, the higher their weight. Does that really mean that eating more donuts will mean you weigh more? What about other factors like exercise? To get a better appreciation of what is happening, it might be best to include exercise and create a multivariate model, but we will cover that later.


No comments:
Post a Comment