Showing posts with label statistical testing. Show all posts

Saturday, March 14, 2009

Testing for Independence

Suppose we want to know if people who smoke are more likely to get cancer than people who don't smoke.

Such a question requires testing for independence. In this case we are trying to see if the chance of getting cancer is related to smoking.

The test statistic is based on the chi-square distribution and is the same as with tests for homogeneity.

The null hypothesis assumes independence, while the alternative assumes dependence.
Or in other words, the null says that smoking doesn't cause cancer, while the alternative states that smoking does cause cancer.

Often, plotting the data in a table can give a convincing overview, i.e.:


Smoke
YesNo
CancerYes6816
No97


Please note that the data in that table is fictional, and only used for example purposes. Also, please know that presentation of a data in a table, while effective, is not a substitute for statistical testing.

Friday, March 13, 2009

Test statistic for Homogeneity

In order to test for homogeneity we have to look at the difference of each proportion from the extepected value. For example, looking at income and whether the person rents or owns, we can form some hypothses

at < 30,000 income 30% own homes and 70% rent
at > 80,000 income 70% own homes and 30% rent

Thus we can take our sample and find that

at < 30,000 income 40% own homes and 60% rent
at > 80,000 income 60% own homes and 40% rent

To find our test statistic we take the sum of the actual value from the expected, divided by the expected.

sum across i and sum across j (nij - eij)2 / eij

We use the resultant test statistic and find where it falls on the x-axis of a chi-square distribution. If it falls so that the area to the right and the area above the point is sufficiently less than 0.05 (or our probability tolerance) we assume the data is homogeneous.

Wednesday, March 11, 2009

Setting Hypothesis for Categorical Data

We looked at setting categorical variables yesterday. Now we look at setting hypothesis for this data.

Suppose are categories are
1 = Those less than 18
2 = Those 18-70
3 = Those 70 or more

and we hypothesize that

p1: 20% are less than 18
p2:70% are 18-70
p3:and 10% are 70 or more

To test this we set
H0 null hypothesis (innocent):
p1: 20% are less than 18
p2:70% are 18-70
p3:and 10% are 70 or more

H1 alternative hypothesis (guilty):
not null (H0)

To test this we would take samples from the population and assess how close the proportions are to our hypothesized values. I.E. how many in our sample are 18 and under and so on....

Then we would calculate "goodness of fit" for how close our sample is to our hypothesis, this can be found by:

X^2 = sum (n(i) - e(i))^2 / e(i)

Where n is estimated proportion from our sample, and e is the expected or hypothesized proportion.

example:
We take a sample of 100 people and find that 25 are under 18 (25%) (we hypothesized 20%)
Thus X^2 = (25-20)^2 / 20 = 5^2 / 20 = 25/20 = 1.25

From this we get the X^2 test statistic which can be used to find the probability of being close enough using the chi-square distribution.

Monday, March 9, 2009

Hypothesis testing for a sample mean

Testing a sample mean is much like testing a proportion except you use the t-distribution instead of the normal curve, and the t-distribution takes sample size and degrees of freedom into account. Like with the confidence intervals for samples.

Saturday, March 7, 2009

Testing the Hypothesis

The past two days we went over creating a hypothesis and the types of errors that can be made when testing.

Now we will look at testing.

First we make a hypothesis.
Then we take a sample of the population to test the hypothesis.
As with confidence intervals we assume that the sample is random, and that the population is large enough to be normally distributed.

In this way we can use the normal curve to find the probability of our hypothesis being correct. To do this we have to find the point on the x-axis of the normal curve that relates to our data, this is called the Z-statistic.
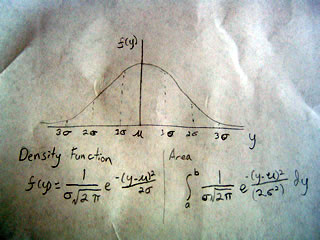
Normal curve

To find the z-statistic we have to subtract our estimate from our hypothesized value and divide it by the standard error.

Z = (u - u(0)) / H

where u(0) is our hypothesized value
and H is standard error


Once we have our Z statistic we see where it falls on the normal curve, again here are some probabilities associated with particular Z statistics...
90% z=1.645
95% z=1.96
98% z=2.33
99% z=2.58

Most science looks for a Z stat around 2 which gives between a 95-98% chance of making a correct conclusion.

Example.

You like wine, but your friend likes cheese. You hypothesize that more people prefer wine to cheese. You take a random sample of 200 people and find that 57% of people like prefer wine to cheese with a standard error of 3% ... is your hypothesis wrong?

H(O) Null hypothesis: Most people do not prefer wine to cheese
H(1) Alternative hypothesis: Most people prefer wine to cheese

Let us look at the Z statistic

(estimate - hypothesized) / standard error

Z = (57% - 50%) / 3% = 2.3

We get a Z statistic of 2.3 which means you have a 98% chance of being right, that most people prefer wine to cheese.

Friday, March 6, 2009

Type One and Type Two Errors

Yesterday we covered the null and alternative hypothesis, where

the null can be seen as: not guilty
alternative can be seen as: guilty

Because all statistical tests are made with a degree of probability(termed confidence)
there are chances of making errors in our conclusions which can be expressed in two ways:

Type 1 error: Claiming innocence when there is guilt
Type 2 error: Claiming guilt when there is innocence

Example:

Null: IQ doesn't affect school grades
Alternative: IQ affects school grades

Type 1: We conclude IQ does affect grades, when it really doesn't
Type 2: We conclude that IQ does not affect grades, when it really does


There is no need to break your head trying to understand this, just know that whatever conclusion is made from a statistical test, there is always a chance of it being wrong.

As a rule of thumb, science tries to make sure it is correct 1 out of a 100 times. But 1 in 20 and 1 in 10 are also passable.

Thursday, March 5, 2009

Hypothesis Testing: The Null and Alternative

What is a hypothesis? Any question that has a cause and effect. Statistics is often used to try answer such questions:

Does IQ relate to school grades?
Does smoking cause cancer?
Do caps protect you from aliens?

All these questions are hypothesis.

To statistically test hypothesis, they must be broken into two parts:
The null hypothesis
The alternative hypothesis

The null hypothesis always asserts the theory is false, while the alternative assumes it is true.

Null: IQ doesn't affect school grades
Alternative: IQ affects school grades

Null: Smoking doesn't cause cancer
Alternative: Smoking causes cancer

Null: Caps do not protect you from aliens
Alternative: Caps protect you from aliens

Null: Not guilty
Alternative: Guilty

Tomorrow we will look at type I and type II errors