Now we will look at testing.
First we make a hypothesis.
Then we take a sample of the population to test the hypothesis.
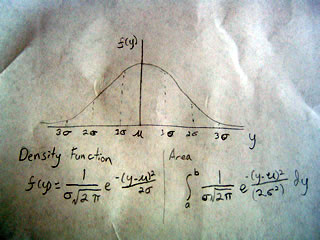
As with confidence intervals we assume that the sample is random, and that the population is large enough to be normally distributed.
In this way we can use the normal curve to find the probability of our hypothesis being correct. To do this we have to find the point on the x-axis of the normal curve that relates to our data, this is called the Z-statistic.
To find the z-statistic we have to subtract our estimate from our hypothesized value and divide it by the standard error.
Z = (u - u(0)) / H
where u(0) is our hypothesized value
and H is standard error
Once we have our Z statistic we see where it falls on the normal curve, again here are some probabilities associated with particular Z statistics...
90% z=1.645
95% z=1.96
98% z=2.33
99% z=2.58
Most science looks for a Z stat around 2 which gives between a 95-98% chance of making a correct conclusion.
Example.
You like wine, but your friend likes cheese. You hypothesize that more people prefer wine to cheese. You take a random sample of 200 people and find that 57% of people like prefer wine to cheese with a standard error of 3% ... is your hypothesis wrong?
H(O) Null hypothesis: Most people do not prefer wine to cheese
H(1) Alternative hypothesis: Most people prefer wine to cheese
Let us look at the Z statistic
(estimate - hypothesized) / standard error
Z = (57% - 50%) / 3% = 2.3
We get a Z statistic of 2.3 which means you have a 98% chance of being right, that most people prefer wine to cheese.


No comments:
Post a Comment